Ijraset Journal For Research in Applied Science and Engineering Technology
- Home / Ijraset
- On This Page
- Abstract
- Introduction
- Conclusion
- References
- Copyright
Vibration Analysis for Bearing Fault Detection: A Comparison of Thomson Multitaper Periodogram, Welch’s periodogram, and Gaussian Filter Bank Algorithms.
Authors: Prof. Jitendra Gaikwad , Srushti Patil, Sakshi Sarpe, Sejal Pembarti , Yukta Saraf
DOI Link: https://doi.org/10.22214/ijraset.2024.65574
Certificate: View Certificate
Abstract
One of the most effective techniques in condition monitoring is vibration analysis. This paper presents a comprehensive approach to bearing fault detection using vibration analysis, leveraging advanced signal processing techniques. The study focuses on three primary algorithms: Gaussian Filter Bank, Welch\'s Periodogram, and Thomson’s Multitaper Periodogram. Each algorithm\'s efficacy is evaluated in terms of its ability to identify and isolate characteristic fault frequencies in bearing vibration signals. The Gaussian Filter Bank is employed for its superior frequency resolution and adaptability to non-stationary signals. Welch\'s Periodogram is utilized for its robust performance in estimating power spectral density with reduced noise variance. Thomson’s Multitaper Periodogram is chosen for its enhanced spectral estimation capabilities and reduced spectral leakage. Experimental results demonstrate that these algorithms, when applied to vibration data, can effectively detect and diagnose various types of bearing faults, offering significant improvements in predictive maintenance strategies.
Introduction
I. INTRODUCTION
Approximately 40% bearing faults result in machine failures. This failure may be due to many reasons such as lubrication issues, corrosion, exposure to environmental conditions,etc. A study on bearing fault detection utilizing vibration analysis algorithms is being done in order to address this issue. In this study, predictive maintenance is utilized to anticipate equipment defects before they occur, minimizing downtime and optimizing maintenance efforts. Predictive maintenance plans heavily rely on condition monitoring techniques like vibration analysis. Bearing fault detection is a critical aspect of predictive maintenance in rotating machinery, ensuring operational efficiency and preventing catastrophic failures. Bearings, integral components in machinery, often suffer from faults due to wear and tear, leading to vibrations that can be analyzed to detect these faults early. Vibration analysis is a non-invasive and effective method for monitoring the health of bearings. It involves capturing vibration signals from machinery and processing these signals to identify characteristic fault frequencies. Among the various techniques for vibration signal analysis, Gaussian Filter Bank, Welch's Periodogram, and Thomson’s Multitaper Periodogram are notable for their ability to provide detailed insights into the frequency components of vibration signals, thus aiding in accurate fault detection.
The implementation of Gaussian Filter Bank, Welch's Periodogram, and Thomson’s Multitaper Periodogram in bearing fault detection illustrates the strengths of these algorithms in processing and analyzing vibration signals.
Each method contributes uniquely to enhancing the detection accuracy of bearing faults, offering valuable insights for predictive maintenance and reliability engineering.
II. RELATED WORK
- P.Venkata Vara Prasad et.al “Detection of Bearing Fault Using Vibration Analysis and Controlling the vibrations”. The vibration-based monitoring method successfully detects faults in bearings, providing valuable insights for predictive maintenance. By leveraging FFT spectrum analysis, this approach allows for early fault detection, reducing unplanned downtime and maintenance costs. The study emphasizes the importance of understanding machinery characteristics and utilizing vibration analysis as a proactivetool in industrial maintenance.
- Surojit Poddar, et.al “Ball Bearing Fault Detection Using Vibration Parameters”. This paper summarizing the key observations from the FFT spectra analysis. It notes the detection of specific bearing fault frequencies, slight variations from calculated frequencies due to slip phenomenon, and the presence of harmonics indicating potential setup issues. Overall, the paper provides valuable insights into the application of FFT spectra for diagnosing ball bearing faults, showcasing the experimental results and emphasizing the importance of early detection in preventing machinery failures.
- Zhenyu Yang, et.al “A Study of Rolling-Element Bearing Fault Diagnosis Using Motor’s Vibration and Current Signatures”. This paper explores fault detection and diagnosis for rolling-element bearings using signal-based methods, focusing on motor vibration and phase current measurements. This study employs the envelope detection method for preprocessing vibration data and utilizes the Fast Fourier Transform (FFT) algorithm for vibration analysis. Current spectrum analysis involves the use of Short-Time FFT (STFFT). Various fault scenarios, including single and multiple point-defects, as well as generalized roughness conditions are tested.
- Tristan Plante, et.nl “Vibration Analysis: Fault Detection and Failure Prediction”. This paper focuses on the application of vibration analysis for fault detection and failure prediction in rotating equipment, with a specific emphasis on electric motors. The study aims to enhance machine uptime through proactive equipment monitoring, reducing the risks of unplanned failures and subsequent plant outages. The experiments involve three fault conditions - unbalance, mechanical looseness, and bearing faults - conducted on a three-phase AC electric motor.
- Meng Wang, et.nl “Bearing fault detection by using graph autoencoder and ensemble learning”. This research provides a new ensemble learning-based graph neural network based fault detection technique for bearing defects. Early bearing faults are typically random, have small amplitude characteristic signals, and are easily obscured by noise and interference from the system. A combinatorial approach to solve this problem is provided, which first transforms the original dataset into a graph dataset and then aggregates the features of nearby nodes using a feature aggregation module. Afterwards, integrated learning is used for unsupervised bearing defect detection. In order to develop correlations between initially independent signals, the process entails transforming vibration signals into graphs. After entering the dataset and matching graphs into the feature aggregation module, fault detection is made possible via a fresh approach to integrated learning.
III. PROPOSED SYSTEM
For vibration analysis of a motor's bearing, A 3000 rpm industrial PMDC motor is used. An accelerometer is mounted on the motor which detects vibrations . The NI 9234 signal acquisition module (DAQ card) is a device that digitalizes incoming analogue signals so that the computer can interpret them. It serves as an interface between computers and signals from the outside world. The card is connected to the accelerometer and the computer.
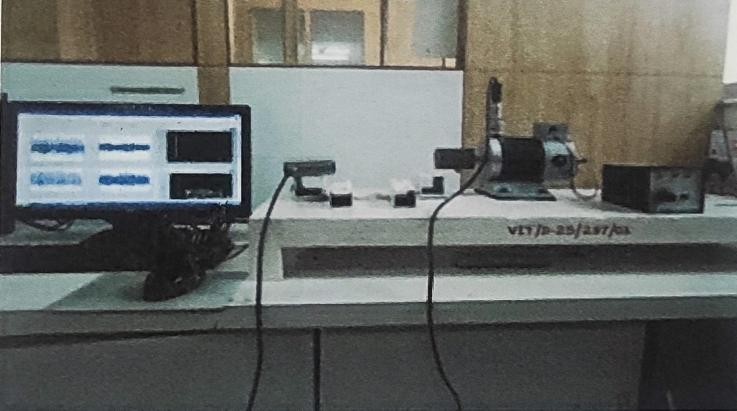
Fig. 1. Setup
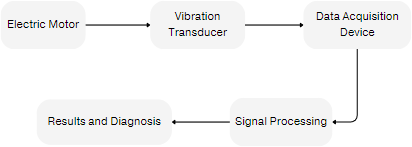
Fig. 2. Block Diagram
The vibration analysis system for bearing fault detection is shown in the above block diagram. This is how the procedure is broken down:
- Electric Motor: The motor under observation is represented by the block with the label "Electric Motor." In a motor, bearings are crucial pieces that reduce friction between spinning parts.
- Vibration Transducer: When the motor operates, wear on the bearings or other problems cause vibrations. These mechanical vibrations are transformed into electrical impulses by the vibration transducer.
- Data Acquisition Device: Next, the vibration transducer's electrical signals are transmitted to the data acquisition device. This apparatus transforms the analog electrical impulses into a digital format so that a computer can process them further. Signal processing: Next, significant features from the vibration signal are extracted using the digital data. The vibration signal can be transformed from the time domain into the frequency domain using methods such as the Fast Fourier Transform (FFT).
- Results and Diagnosis: The analysis of the processed data is shown in the last block. Through feature extraction from the signal processing stage, the system can identify bearing defects or anticipate bearing failures by comparing the features with reference data or predetermined criteria.
Thus, for accurate diagnosis of bearing faults and identifying fault frequencies, we have implemented the following three algorithms such as Gaussian filter bank, Welch’s Periodogram, and Thomson’s Multitaper periodogram.
A. Gaussian filter bank
Gaussian filter bank is designed using signal processing tools such as convolution, gaussian function. The Standard deviation (σ) in gaussian function plays an important role in its behavior. The gaussian filter is a non-uniform low pass filter. It is used to blur images and remove noise.
DESIGNING STEPS:
- Gaussian function plot is obtained in MATLAB software.
- Then Gaussian function plot is convoluted with vibration signal.
- Finally Resulted filtering sequence passed through Fast Fourier Transform (FFT) for harmonic analysis.
- Above steps are repeated and tested for different values of standard deviation in gaussian function.
Bearing Characteristic frequencies:
There are four main types of vibration frequencies that relate to the different components of the bearing. They include the ball pass frequencies of the inner and outer race, the fundamental train frequency and the ball/roller spin frequency For calculating defect frequencies number of balls (Nb), pitch diameter(Pd) to ball diameter (Bd) ratio, running speed i.e. rotating frequency of shaft (fs) and contact angle β are needed and thus failure detection and diagnosis of bearing is done. For each type of fault in bearing, a specific characteristic frequency is associated. Characteristic frequencies are the functions of bearing geometry and rotating shaft frequency fs and calculated with the following formulae:
BP F O = N b/2[1 − (Bd/P d)cosβ]fs (1)
BP F I = N b/2[1 − (Bd/P d)cosβ]fs (2)
BSF = N b/2[1 − (Bd/P d) 2 cosβ]fs (3)
B. Welch’s Periodogram
The periodogram method estimates power spectrum using DFT. To produce a discrete time signal x[n], sample a continuous time signal x(t). Then, x[n] = x(nT), where T is the sampling interval. The Wiener-Khintchine theorem defines the power spectral density estimate of x[n] at frequency f as the DTFT of the autocorrelation function of x[n], rxx[k], as illustrated in (5).
By substituting equation (5) in equation (4) the power spectrum density is calculated as:
(????) = 1/N |????(????)2| (6)
Where X(f) represents the DFT of x[n].
The periodogram approach remains the most often used tool for detecting failures in literature.
Welch's Periodogram method divides the data sequence x[n],
{x[0],x[1],…,x[N-1]}, into K segments. Each segment has L samples and can overlap with (L-S) overlapping samples. S represents the number of points to shift between segments.
Segment 1: x[0],x[1],…,x[L-1]
Segment 2: x[S],x[S+1],…,x[L+S-1]
Segment K: x[N-L],x[N-L+1],…,x[N-1]. (7)
The average welch power spectrum density can be estimated by the following equation
Pw(f) = 1/K ∑????−1 ???????????????? (????) (8)
C. Thomson's Multitaper periodogram
Thomson's multitaper periodogram improves spectral estimation by reducing variance and spectral leakage using multiple orthogonal tapers (Slepian sequences). For a time series x[n], each taper vk[n] is applied to produce a set of tapered series xk[n]=x[n]⋅ vk[n]. The multitaper PSD estimate, PMT(f) is the average of these individual PSDs across all K tapers, where K=2NW−1 for a chosen time- bandwidth product NW, balancing resolution and variance reduction. In DPPS technique, they are eigenfunctions of a spectral concentration problem and are designed to maximize energy concentration within a given frequency band.
For a time series of length N, each taper vk[n] (where n=0,1,…,N−1) is chosen to satisfy:
Fourier Transform of each Tapered Series:
For each tapered time series xk[n], compute the discrete Fourier transform (DFT) to obtain the eigenspectrum:
For Power Spectral Density for each taper :
The PSD estimate for each taper k is obtained by taking the squared magnitude of the Fourier transform:
For Averaging Eigen spectra:
The final multitaper PSD estimate PMT(f) is the average of the individual PSD estimates across all K tapers:
IV. RESULT AND DISCUSSION
The readings of the industrial motor were taken at different speeds 1000rpm, 1200rpm, and 1500 rpm, at different weights 1kg, 2kg, 3kg, and no load, and with different bearing inner race defect, outer race defect, normal bearing, ball bearing, etc.
The graphs and data for 200 Hz frequency, 1000 rpm, and 1 kg load are shown below.
A. Normal bearing:
1) Thomson estimate
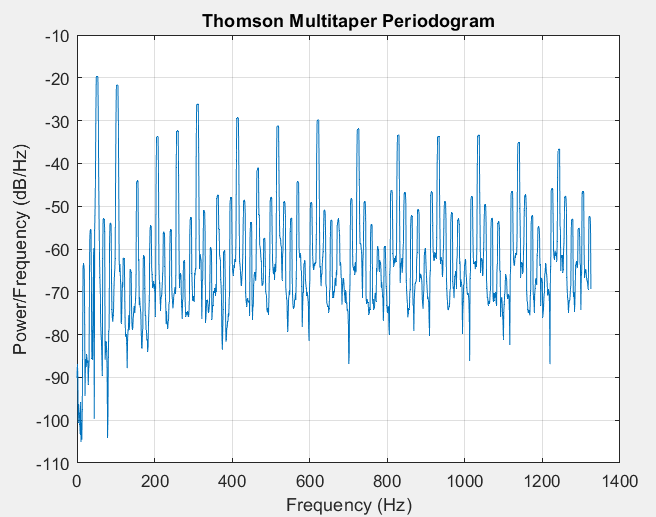
Fig. 3
2) Welch’s estimate
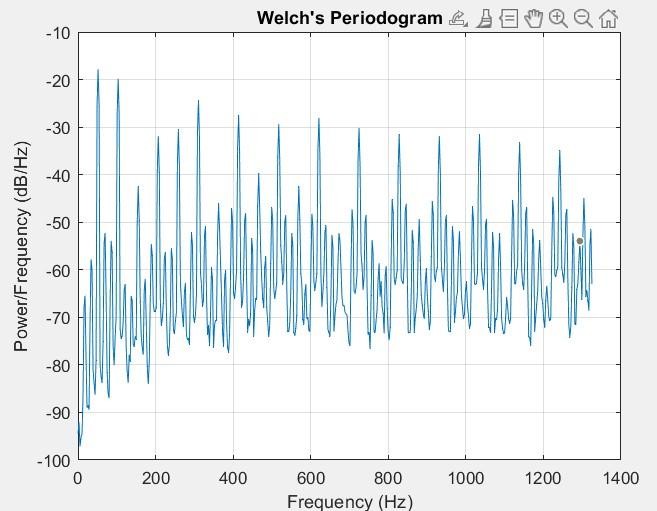
Fig. 4
3) Gaussian filter bank
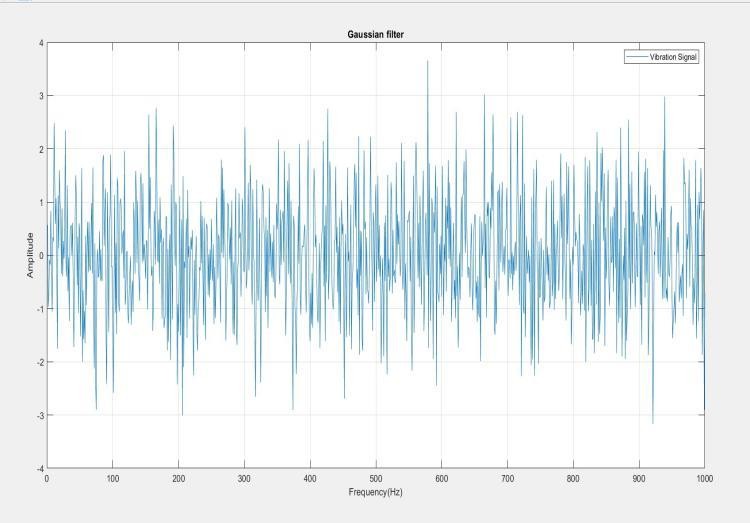
Fig. 5
B. Inner race defect Gaussian filter bank
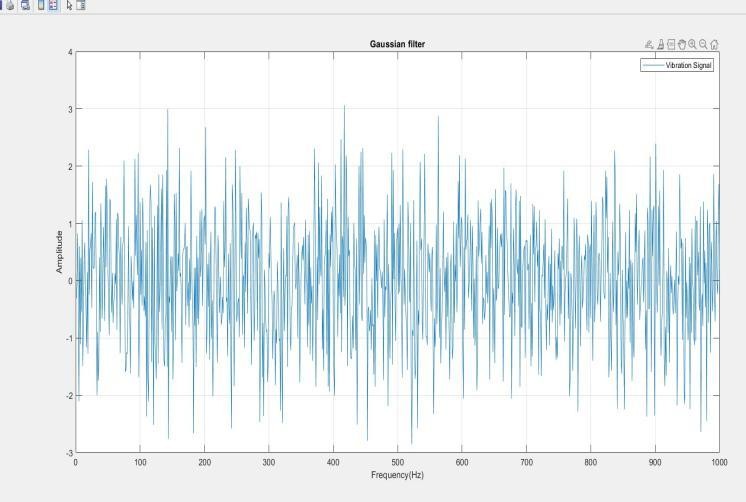
Fig. 6
C. Outer race defect
1) Thomson estimate
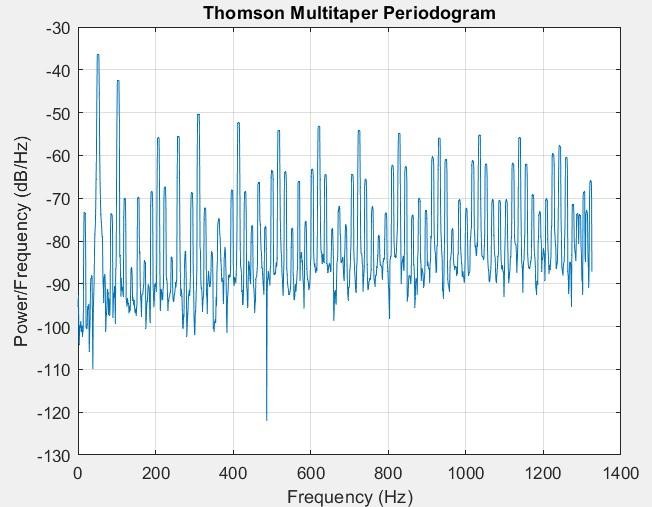
Fig. 7
2) Welch’s estimate
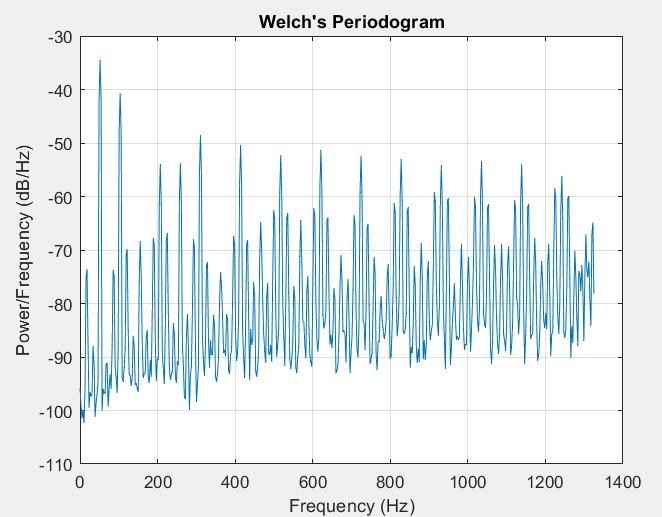
Fig 8
3) Gaussian filter bank
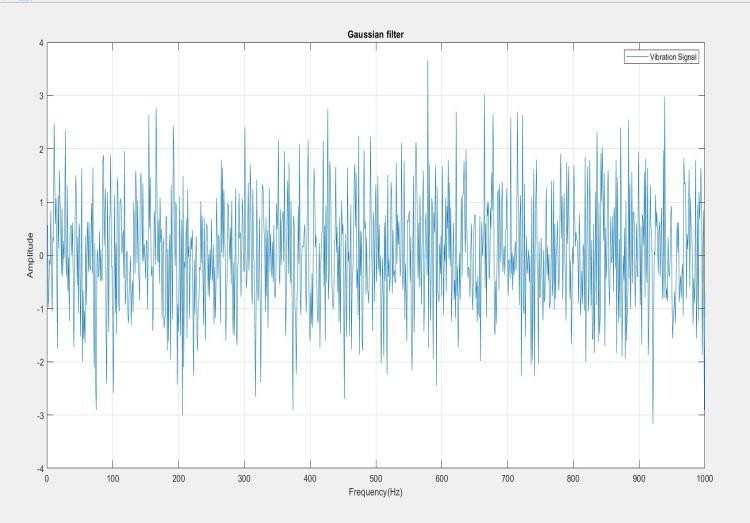
Fig. 9
Comparative Study
The decision between the Thomson multitaper method, the Welch periodogram, and the Gaussian filter bank for bearing fault identification is determined by a number of criteria, including the signal's unique features, processing resources available, and the quantity of noise in the data. If you are dealing with short or noisy data, the Thomson multitaper approach may be preferable. Welch's approach may be suitable for longer data sequences that require a balance of frequency resolution and computing efficiency. Ifthe fault frequencies are well-defined and distinct, and you have experience designing filter banks, the Gaussian filter bank approach may be useful. Ultimately, the best option is determined by the specific characteristics of your data and the needs of your application.
Conclusion
Bearing fault detection using vibration analysis is enhanced by Thomson\'s multitaper method, Welch\'s periodogram, and Gaussian filtering. Thomson\'s multitaper reduces spectral leakage and variance for clear fault identification. Welch\'s periodogram improves spectral estimate reliability through segment averaging. Gaussian filtering isolates significant fault-related frequencies by smoothing the signal. Combining these methods provides a comprehensive, accurate, and robust approach to detecting bearing faults, leading to better maintenance and reduced machine downtime.
References
[1] Vara prasad, P. & Kumar, V.Ranjith. (2015). Detection of Bearing Fault Using Vibration Analysis and Controlling the vibrations. INTERNATIONAL JOURNAL OF ENGINEERING SCIENCES & RESEARCH TECHNOLOGY. 4. 539-550. [2] Chandravanshi, M. & Poddar, Surojit. (2013). Ball Bearing Fault Detection Using Vibration Parameters. International Journal of Engineering Research & Technology. [3] Yang, Zhenyu. (2009). A Study of Rolling-Element Bearing Fault Diagnosis Using Motor\'s Vibration and Current Signatures. IFAC Proceedings Volumes. 42. 354-359. 10.3182/20090630-4-ES-2003.00059. [4] Plante, Tristan & Nejadpak, Ashkan & Yang, Cai Xia. (2015). Vibration Analysis: Fault Detection and Failure Prediction. [5] Wang, Meng & Yu, Jiong & Leng, Hongyong & Du, Xusheng & Liu, Yiran. (2024). Bearing fault detection by using graph autoencoder and ensemble learning. Scientific Reports. 14. 10.1038/s41598-024-55620-6. [6] S. Chinchmalatpure, J. Pingle, S. Sarpe, S. Pembarti and Y. Saraf, \"IOT Based Smart Food Dehydration and Grinder System for Agricultural Usage,\" 2023 7th International Conference On Computing, Communication, Control And Automation (ICCUBEA), Pune, India, 2023, pp. 1-5, doi: 10.1109/ICCUBEA58933.2023.10392137. [7] P. Kanjalkar, S. Patil, S. Pembarti, S. Sarpe and J. Kanjalkar, \"Resume Building and Course Recommendation System,\" 2024 IEEE International Conference for Women in Innovation, Technology & Entrepreneurship (ICWITE), Bangalore, India, 2024, pp. 706-709, doi: 10.1109/ICWITE59797.2024.10503109. [8] A. T. Walden, “A unified view of multitaper multivariate spectral estimation,” Biometrika, vol. 87, no. 4, pp. 767–788, 2000. [9] Debasis Kundu and Swagata Nandi,”Analyzing Non-stationary Signals Using Generalized Multiple Fundamental Frequency Model.” [10] D. M. Yang, “Induction motor bearing fault detection using wavelet based envelope analysis”, International Symposium on Computer, Consumer and Control, pp.12411244, 2014. [11] Pravesh Durkhure, Akhilesh Lodwal INTERNATIONAL JOURNAL OF ENGINEERING SCIENCES & RESEARCH TECHNOLOGY Fault [12] Diagnosis of Ball Bearing using Time Domain Analysis and Fast Fourier Transformation,Indore (2014). [13] Lakshmi Pratyusha,ShanmukhaPriya,VPS Naidu, Bearing Health Condition Monitoring: Time Domain Analysis International Journal of Advanced Research in Electrical, Electronics and Instrumentation Engineering December(2014). [14] Yogita K Chaudhari ?Vibration Analysis for Bearing Fault Detection in Electrical Motors?, ICNSC-14,(2014). [15] P. G. Kulkarni, A. D. Sahasrabudhe Application of Wavelet Transform for Fault Diagnosis of Rolling Element Bearings (2013). [16] Milind Natu, Bearing Fault Analysis Using Frequency Analysis and Wavelet Analysis, International Journal of Innovation, Management and Technology, Vol. 4, No. 1, February (2013). [17] N. Tandon, A.Choudhury,?A review of vibration and acoustic measurement methods for the detection of defects in rolling element bearings, Tribology International, vol. 32, pp. 469-480, 1999. [18] N. Tandon, -A comparison of some vibration parameters for the CM of rolling element bearings, Measurement, vol. 12, pp. 285-289, 1994. [19] [18]Y. T. Su and S. J. Lin,-On initial fault detection of a tapered roller bearing: frequency domain analysis, Journal of Sound and Vibration, vol. 155, no.1, pp. 75-84, 1992. [20] Pratesh Jayaswal, A. K. Wadhwani and K. B. Mulchandani,-Rolling element bearing fault detection via vibration signal analysis, The Icfai University Journal of Science &Technology, vol. 4, no.2, pp. 7-20, 2008. [21] Cheng Junsheng, Yu Dejie, Yang Yu, -Application of an impulse response wavelet to fault diagnosis of rolling bearings, Mechanical Systems and Signal Processing, vol. 21, pp. 920-929, 2007.
Copyright
Copyright © 2024 Prof. Jitendra Gaikwad , Srushti Patil, Sakshi Sarpe, Sejal Pembarti , Yukta Saraf. This is an open access article distributed under the Creative Commons Attribution License, which permits unrestricted use, distribution, and reproduction in any medium, provided the original work is properly cited.

Download Paper
Paper Id : IJRASET65574
Publish Date : 2024-11-27
ISSN : 2321-9653
Publisher Name : IJRASET
DOI Link : Click Here
 Submit Paper Online

