Ijraset Journal For Research in Applied Science and Engineering Technology
- Home / Ijraset
- On This Page
- Abstract
- Introduction
- References
- Copyright
Water Potability Prediction Using Machine Learning
Authors: Revathi M, Dr. N. A. Vasanthi
DOI Link: https://doi.org/10.22214/ijraset.2024.63684
Certificate: View Certificate
Abstract
For human survival, water is an essential and indispensable resource, and preserving its purity is paramount to people\'s health. Contaminated drinking water can lead to serious health problems, such as cholera, diarrhea, and other waterborne illnesses. Thus, maintaining clean and safe water becomes essential to advancing public health. Recent research indicates that water-related ailments claim the lives of a noteworthy 3,575,000 individuals annually. Thus, a reliable indicator of water potability could significantly lower the prevalence of these illnesses. Machine learning algorithms have emerged as highly effective instruments for precisely and promptly monitoring water resources by accurately forecasting the quality of the water. The Drinking Water dataset on Kaggle is the source of the water samples used in this study, and various algorithms are used to estimate water potability based on these properties. Nine different metrics make up this dataset: pH, hardness, solids, trihalomethanes, sulphates, chloramines, organic carbon, conductivity, and turbidity. We seek to ascertain the potability of drinking water by utilizing a variety of algorithms, including Random Forest, SVM, Decision Tree, and KNN. Among other notable results, the Random Forest algorithm outperforms conventional machine learning models, producing an astounding accuracy of 99.5%. It also performs well, producing an accuracy of 74%. As a result, this study has great potential to supply researchers, water management professionals, and policymakers with accurate data on water quality, increasing the efficacy of water potability monitoring.
Introduction
I. INTRODUCTION
one of the most essential elements for the survival of life on earth is water. it matters just as much to people as it does to animals. not only does water keep us alive, it is essential to our daily activities. when we give it some thought, we may find a lot of uses for it. potable water is defined as water that has undergone enough filtration, treatment, and final removal of all impurities and dangerous pathogens. After the purification procedures, this water is safe to use for drinking as well as cooking, or it can be referred to as "drinking water." there are several ways to purify water, including uv-filtered water purifiers and reverse osmosis. raw water is defined as any water that is not suitable for human consumption and typically comes from sources such as rivers, lakes, and groundwater. though it can lead to serious health issues, non-potable water occasionally tastes just like potable water. in developed nations, many are unaware of the water's source. water is the major important resource of mankind. in everyday life, people use water frequently. it is one of the most needs of human beings to avoid skin and lung diseases, we must use good-quality water. for this purpose, we have to calculate the value of the water quality index of our daily usage water, water quality assessment methods differ in their methodology as well as their input parameters [2]. THE most frequent water quality index methods are the national sanitation foundation method, oregon water quality index method, weighted arithmetic water quality index method. in this research paper, we adopted the weighted arithmetic water quality index method. we calculated the important parameters: salinity, total suspended solids (tds), dissolved oxygen (do), acidity and alkalinity (ph), and biochemical oxygen demand (bod) and tabulated as a csv file [16].
II. LITERATURE SURVEY
Water is essential for the continuation of life and ensuring the safety and accessibility of drinking water is a pressing global issue. There has been a lot of research on using machine learning in the water quality index (wqi), water quality classification (wqc) [ 1]. In a study by a comparison of water quality classification models employing machine learning algorithms viz., svm, decision tree and naïve bayes. The features considered for determining the water quality are: ph, do, bod and electrical conductivity.
The classification models are trained based on the weighted arithmetic water quality index (wawqi) calculated [3].they used ph, total dissolved solids, temperature, and turbidity as four features, the proposed methodology employed 13 physical and chemical parameters of water quality and 7 ml models that are decision tree, artificial neural networks,k-nearest neighbors, naïve bayes, support vector machine, random forest with a learning error rate prediction performance compared to the other algorithms. It had the highest accuracy with the lowest classification error [4]. In this work [5], the adaptive neuro-fuzzy inference system (anfis) algorithm was developed to predict the water quality index (wqi). Feed-forward neural network (ffnn) and k-nearest neighbors were applied to classify water quality. The dataset has eight significant parameters, but seven parameters were considered to show significant values. In this examines artificial intelligence’s advancement in water quality prediction from different angles ann, fuzzy, svm, and other ai models. Groundwater, ponds, lakes, and rivers all water resources were all included in the survey method [6]. In this paper [15] “water potability prediction using machine learning” focuses on multiple algorithms to forecast water potability based on the physicochemical properties of water samples obtained from the drinking water dataset comprises nine distinct parameters by employing various algorithms, such as random forest, logistic regression, svm, xgboost and knn, to determine the potability of drinking water. In this study [18], were to develop a framework for assessing performance of wqi model in order to correct classification of coastal water quality. Four machine-learning classifier algorithms were utilized to identify the best algorithm for predicting water quality class.in this paper [17], looked into an alternative machine learning method for predicting water quality using only a few simple water quality criteria. To estimate, a set of representative supervised machine learning algorithms was used. In this study paper , the statistical and ml algorithms were used in this research that provided highly accurate results; it will be beneficial to use deep learning algorithms, for instance, convolution neural network, to cross-check the results and compare them with this study to yield holistic results [19].
III. METHODOLOGY
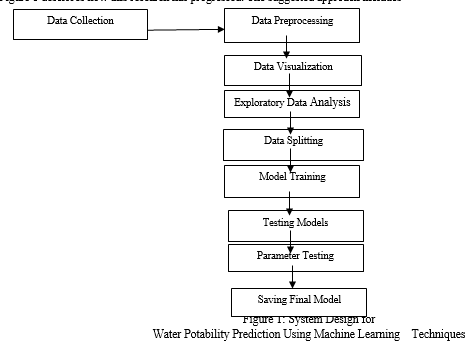
Because there are many physical, chemical, and biological elements that affect the quality of drinking water, maintaining water potability is a difficult undertaking [11][12]. Machine learning methods have become useful for predicting water quality and determining the potability of water. This study presents a method for predicting water potability using machine learning models. The main goal of this research is to create a more accurate model for predicting water potability, which would enable effective water management and guarantee the supply of clean drinking water in communities. The study of the “Water Quality Prediction Using Machine Learning”, gather the information he capacity of five distinct machine learning algorithms to predict the separate components of a dataset containing information about water quality was evaluated, examined, and compared [7].

A. Data Collection
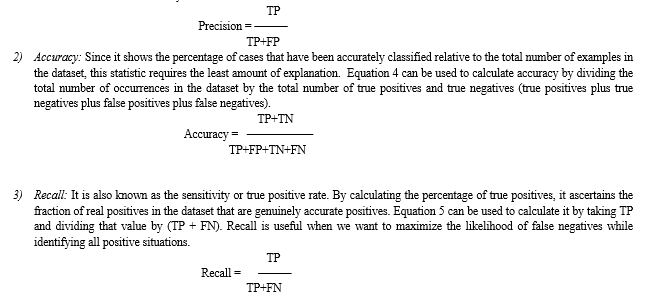
The main data source for this study was a Kaggle dataset that was made available to the public. This dataset includes 3276 water quality observations that were gathered from various locations. It also includes a target feature called portability, which is used to make predictions using a variety of machine learning algorithms, along with nine different physicochemical parameters: pH, hardness, solids, chloramines, sulphates, trihalomethanes, organic carbon, conductivity, and turbidity.
- Water Quality Parameter: There are three main water quality parameters to measure the quality of water: physical, chemical, and biological. Physical water quality parameters include eight principle indicators: electrical conductivity, salinity, total dissolved solids, turbidity, temperature, color, and taste and odor. Chemical water parameters include pH, acidity, alkalinity, hardness, chlorine, and dissolved oxygen. The final water quality is biological, which includes bacteria, algae, nutrients, and viruses.
- Water Quality Index(WQI): "The Water Quality Index (WQI)" is a comprehensive water quality indicator that takes into account a number of variables. Nine distinct parameters have historically been used in the WQI calculation. In practice, formula (1) is usually used to try and determine the WQI

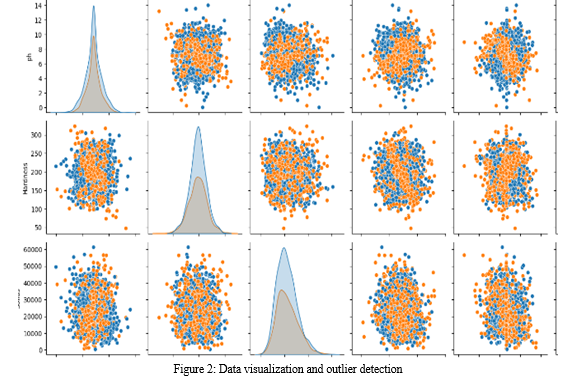
3. Visualizating Data: Data visualization is the act of presenting data visually with the aim of making it simpler to identify trends, correlations, and patterns in the data (Fig. 2). matrix, we can use features that are easily accessible to find patterns and establish dependent features.

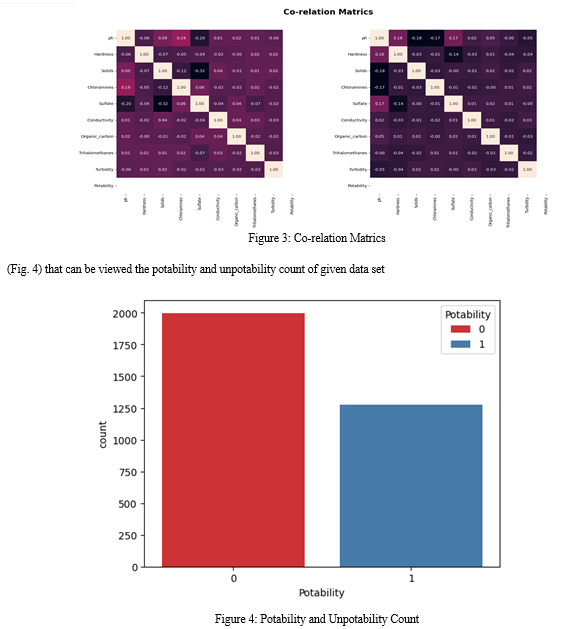
4. Correlation Evaluation: A correlation matrix can be a useful tool for figuring out the likely correlations between a number of different factors by analyzing the correlation coefficients. All possible value pairs are displayed in a table. Through analyzing the heatmap that the correlation generated. Figure 3 of the study presents the relationship between all the attributes, and it is clear that there is very little to no correlation between them. It is therefore not necessary to exclude any of the attributes present in the dataset.

5. Data Splitting: A training set and a testing set of the data must be separated before the machine learning model's performance is examined. It was determined to split the dataset into two subsets: the training set would utilize 67% of the data, while the testing set would use 33%. The objective is to establish a relationship between the independent and dependent parameters so that the model may make inferences or predictions. The test results are then used to calculate the machine learning algorithm's efficacy.
It can evaluate the model's performance by computing accuracy metrics prior to applying it to simulate real-world scenarios because of data partitioning.
IV. WATER POTABILITY USING MACHINE LEARNING ALGORITHMS.
A. Machine Learning Algorithms
Machine learning techniques were applied to the water's potability estimation in order to achieve this aim. Algorithms were used for regression classification, in the course of our inquiry, we employed multiple algorithms.
- Support Vector Machine: Support Vector Machines (SVM) are a tool used for data classification, regression analysis, and outlier identification. The data is successfully divided into multiple groups using a hyperplane that is found using support vector machines (SVM). A hyperplane is a line or plane that maximizes the separation between the two classes. The gap between the closest-to-the-hyperplane data points for each class and the hyperplane itself is known as the margin.
- Decision Tree Classifier: A decision tree is a flowchart-like structure used to make decisions or predictions. It consists of nodes representing decisions or tests on attributes, branches representing the outcome of these decisions, and leaf nodes representing final outcomes or predictions. Each internal node corresponds to a test on an attribute, each branch corresponds to the result of the test, and each leaf node corresponds to a class label or a continuous value.
- Random Forest Classifier: Random Forest algorithm is a powerful tree learning technique in Machine Learning. It works by creating a number of Decision Trees during the training phase. Each tree is constructed using a random subset of the data set to measure a random subset of features in each partition. This randomness introduces variability among individual trees, reducing the risk of overfitting and improving overall prediction performance. In prediction, the algorithm aggregates the results of all trees, either by voting (for classification tasks) or by averaging (for regression tasks) This collaborative decision-making process, supported by multiple trees with their insights, provides an example stable and precise results. Random forests are widely used for classification and regression functions, which are known for their ability to handle complex data, reduce overfitting, and provide reliable forecasts in different environments.
- K-Nearest Neighbor: KNN is one of the most basic yet essential classification algorithms in machine learning. It belongs to the supervised learning domain and finds intense application in pattern recognition, data mining, and intrusion detection. It is widely disposable in real-life scenarios since it is non-parametric, meaning it does not make any underlying assumptions about the distribution of data .W are given some prior data (also called training data), which classifies coordinates into groups identified by an attribute.
B. Measure
The criteria that formed the foundation for assessing the model's success are listed below and may be accessed here.
1) Precision: It can be defined as the ratio of successfully classified instances within a classifier to the entire number of contexts that have been evaluated. TP stands for "positive class," and FP is the precision associated with false alarms. Equation (3) is used to calculate TP. Accuracy is connected to both ideas.

4) F1 Score: F1 Score represents the ideal equilibrium between precision and ease of use. It is a valuable statistic in circumstances when both recall and precision should be taken into account because it achieves a balance between them. It is calculated using the method shown in Equation 6. There are ten possible F1 scores: 0 for the worst score and 1 for the best.
5) Algorithm Outcomes: We used every technique that was previously covered to build the regression and classification model based on the dataset. The model's evaluation process was conducted using the hyperparameter adjustment method.
Table 2
|
S.No |
Algorithm Model |
Accuracy Result |
|
1 |
Support Vector Machine |
0.677250 |
|
2 |
Decision Tree Classifier |
0.746020 |
|
3 |
Random Forest Classifier |
0.789983 |
|
4 |
K-Nearest Neighbor |
0.626362 |
??????????????C. Tunning Hyperparameter
The process of determining the best set of hyperparameters to increase a machine learning model's performance is known as "hyperparameter tuning". We call this procedure "hyperparameter tuning." The pace of learning is one type of hyperparameter. The batch size, the number of hidden layers, and the quantity of neurons in each hidden layer are some other examples. These model parameters have to be provided before training can begin because they cannot be taught during the training process. There are numerous approaches for fine-tuning hyperparameters. These techniques include, for instance, grid search, random search, manual tuning , and Bayesian optimization.
- GridSearchCV: GridSearchCV works by first requesting a grid of possible hyperparameters from the user. It then exhaustively searches through every possible combination of those hyperparameters in the grid. Using the training data, GridSearchCV performs a cross-validation test to assess the model's performance for every conceivable set of hyperparameters. In the end, the hyperparameters that produce the best results are the ones that are chosen as the ideal ones.
- Randomized SearchCV: Initially, each hyper parameter's probability distribution is described using Randomized Search CV. Next, a set of hyperparameter combinations is created, and a random sample is taken from each distribution. Randomized Search CV uses a technique known as cross-validation on the training data to evaluate a model's performance. This is carried out for every potential pairing. The hyper parameters that are chosen as optimal are those that result in the best performance.
Table 3 Result of Tuning Hyper parameter
|
|
Pricision |
Recall |
F1 score |
Support |
|
0 |
0.80 |
0.93 |
0.86 |
510 |
|
1 |
0.84 |
0.62 |
0.72 |
309 |
|
Accuracy |
|
|
0.81 |
819 |
|
Macro Avg |
0.82 |
0.78 |
0.79 |
819 |
|
Weighted Avg |
0.82 |
0.81 |
0.81 |
819 |
V. RESULTS
This study assessed, compared, and evaluated the ability of five different machine learning algorithms to predict the individual elements of a dataset that contained data regarding water quality. Variables from the most well-known datasets, including turbidity, pH, hardness, solids, and electrical conductivity (EC), were collected in order to meet this goal. The results showed that the models' performance level was enough for forecasting measurements of water quality (Table 3). The highest performance levels are exhibited by RF.
References
[1] Md. Saikat Islam Khan a,d , Nazrul Islam b,d, Jia Uddin c , Sifatul Islam a,d , Mostofa Kamal Nasir .” Water quality prediction and classification based on principal component regression and gradient boosting classifier approach” Water Resources ResearchGate(2021): DOI: 10.1016/j.jksuci.2021.06.003. [2] Divya Bhardwaj and Neetu Verma M. TECH Scholar,” Research Paper on Analysing impact of Various Parameters on Water Quality Index.” International Journal of Advanced Research in Computer Science Volume 8, No. 5,(2017): 0976-5697. [3] Neha Radhakrishnan , Anju S Pillai ., “Comparison of Water Quality Classification Models” ResearchGate(2020): ISBN: 978-1-7281-5371-1. [4] Nur Hanisah Abdul Malek , Wan Fairos Wan Yaacob , Syerina Azlin Md Nasir and Norshahida Shaadan. .” Prediction of Water Quality Classification of the Kelantan RiverBasin, Malaysia, Using Machine Learning Techniques” (2018): 33-47. [5] MoslehHmoud Al-Adhaileh ,* and FawazWaselallahAlsaade .” Modelling and Prediction of Water Quality by Using Artificial Intelligence”,MPMD- 2021, 13(8), 4259; https://doi.org/10.3390/su13084259. [6] K.Kalaivanan and J. Vellingiri.,” Survival Study on Different Water Quality Prediction Methods Using Machine Learning”, Nature Environment and Pollution Technology An International Quarterly Scientific Journal.,(2021):vol(21): https://doi.org/10.46488/NEPT.2022.v21i03.032. [7] Dr. Sanjeev Singh, Dr. Dilkeshwar Pandey Shashwat Singh, Anurag Shrivastava, Pankaj Kumar,Prajwal Upman.,” Water Quality Prediction Using Machine Learning”, Section A-Researchpaper(2023),vol(1502-1509): doi: 10.48047/ecb/2023.12.si6.138. [8] Vijay Anand M1, Chennareddy Sohitha1, Galla Neha Saraswathi1 and Lavanya G,”Water quality prediction using CNN”, Journal of Physics: Conference Series, 2484 (2023) 012051, doi:10.1088/1742-6596/2484/1/012051. [9] Amir Hamzeh Haghiabi, Ali Heider Nasrolahi and Abbas Parsaie, “Water quality prediction using machine learning methods”, Water Quality Research Journal, doi: 10.2166/wqrj.2018.025. [10] Mahmoud Y. Shams ,Ahmed M. Elshewey ,El-Sayed M. El-kenawy3,Abdelhameed Ibra him4 ,Fatma M. Talaat1, Zahraa Tarek,” Water quality prediction using machine learning models based on grid search method”, Multimedia Tools and Application, https://doi.org/10.1007/s11042-023-16737-4. [11] Dao Nguyen Khoi , Nguyen Trong Quan , Do Quang Linh , Pham Thi Thao Nhi and NguyenThi Diem Thuy,” Using Machine Learning Models for Predicting the Water Quality Index in the La Buong River, Vietnam”,MDPI (2022),vol- 14, 1552. https://doi.org/ 10.3390/w14101552. [12] Chao-ying joanne peng Kuk lida lee Gary m. Ingersoll,” An Introduction to Logistic RegressionAnalysis and Reporting”,ResearchGate, September 2002, DOI: 10.1080/00220670209598786. [13] Jehad Ali1, Rehanullah Khan2, Nasir Ahmad3, Imran Maqsood,” Random Forests and Decision Trees”, IJCSI International Journal of Computer Science Issues, Vol. 9, Issue 5, No 3, September 2012ISSN (Online): 1694-0814,www.IJCSI.org. [14] Sanjoy Shil1 · Umesh Kumar Singh1 · Pankaj Mehta2,” Water quality assessment of a tropical river using water quality index (WQI), multivariate statistical techniques and GIS”, Applied Water Science (2019) 9:168,https://doi.org/10.1007/s13201-019-1045-2 [15] Samir Patel, Khushi Shah, Sakshi Vaghela, Mohmmadali Aglodiya, Rashmi Bhattad,” Water Potability Prediction Using Machine Learning”,ResearchGate journals, https://doi.org/10.21203/rs.3.rs-2965961/v1 [16] Nayla Hassan Omer,” Water Quality Parameters”, Water Quality - Science, Assessments and Policy, DOI: http://dx.doi.org/10.5772/intechopen.89657. [17] Sai Sreeja Kurra*1, Sambangi Geethika Naidu*2, Sravani Chowdala*3,Sree Chithra Yellanki*4, Dr. B. Esther Sunanda*5,” Water Quality Prediction Using Machine Learning”, International Research Journal of Modernization in Engineering Technology and Science, Volume:04/Issue:05/May-2022 Impact Factor- 6.752 www.irjmets.com. [18] Md Galal Uddin , Stephen Nash , Azizur Rahman , Agnieszka I. Olbert , Performance analysis of the water quality index model for predicting water state using machine learning techniques”, Process Safety and Environmental Protection. [19] P. Krishna Prasad, Kishan Ranjit,” Water Quality Prediction Using Machine Learning Algorithms”, Journal of Engineering Sciences, ol 15 Issue 02,2024. [20] P Ramu, P Suketh Reddy, B Anjali Reddy, Sriraj Katkuri, M Sathyanarayana,” Water Quality Prediction using Machine Learning”, International Research Journal of Engineering and Technology (IRJET) e-ISSN: 2395-0056,Volume: 09 Issue: 12 Dec 2022 www.irjet.net p-ISSN: 2395-0072. [21] V. Queen Jemila1, M. Dhanalakshmi 2 and M.Amutha,” Water Quality Prediction Using Machine Learning Algorithms”,International Journal Of Creative Research Thoughts(IJCRT), Volume 11, Issue 12 December 2023 | ISSN: 2320-2882. [22] Nishant Rawat, Mangani Daudi Kazembe, Pradeep Kumar Mishra,” Water Quality Prediction using Machine Learning”, International Journal for Research in Applied Science & Engineering Technology (IJRA),ISSN: 2321-9653; IC Value: 45.98; SJ Impact Factor: 7.538,Volume 10 Issue VI June 2022- Available at www.ijraset.com.
Copyright
Copyright © 2024 Revathi M, Dr. N. A. Vasanthi. This is an open access article distributed under the Creative Commons Attribution License, which permits unrestricted use, distribution, and reproduction in any medium, provided the original work is properly cited.

Download Paper
Paper Id : IJRASET63684
Publish Date : 2024-07-19
ISSN : 2321-9653
Publisher Name : IJRASET
DOI Link : Click Here
 Submit Paper Online

