Ijraset Journal For Research in Applied Science and Engineering Technology
- Home / Ijraset
- On This Page
- Abstract
- Introduction
- Conclusion
- References
- Copyright
Water Quality Analysis of Water Bodies of Karwi Chitrakoot
Authors: Yoshita Ray, G. S. Gupta
DOI Link: https://doi.org/10.22214/ijraset.2024.64619
Certificate: View Certificate
Abstract
Water has the ability to dissolve most substances and all living organisms depend on it in their living whether these organisms are plants or animals. Groundwater is the cheapest and most practical means of providing water to small communities and it is superior to surface water because the ground itself provides an effective filtering medium. The present study focused to assess the probable ground water predicts zone of defined area as Karwi Block part of Chitrakoot District, Uttar Pradesh India. This study assessed groundwater quality across selected stations. pH ranged from 6.82 to 7.80 (WHO limit: 6.5-8.5), and EC from 695-1800 mg/l, with only S2 exceeding the BIS limit (800 mg/l). Turbidity varied from 0-9.9 NTU. Total hardness (332-884 mg/l) and calcium hardness (53.1-505.1 mg/l) were within BIS limits, while magnesium exceeded the limit (35 mg/l) at S2 and S4. Chloride (40.52-325.3 mg/l), sulphate (61-113.62 mg/l), total solids (440-1410 mg/l), and total dissolved solids (435-1400 mg/l) met permissible standards. The groundwater is mostly safe for consumption, except for elevated magnesium levels at some stations.
Introduction
I. INTRODUCTION
Water quality analysis is one of the most important aspects in groundwater studies. The hydro chemical study reveals quality of water that is suitable for drinking, agriculture and industrial purposes. Further, it is possible to understand the change in [1, 2] quality due to rock water interaction or any type of anthropogenic influence. Ground water quality depends on the quality of recharged water atmospheric precipitation inland surface water and sub-surface geochemical processes. Temporal change in the origin and constitution of the recharged water, hydrological and human factors may cause periodic change in ground water quality. Water pollution not only affects water quality but also threats human health, economic development and social prosperty. Ground water is a source of drinking water and even today more than half of the word population depends on ground water for survival. The assessment of water quality is very important for knowing the suitability for various purpose. Assessment of ground water for drinking and irrigation has become a necessary and important task for present and future ground water quality monitoring and evaluation for domestic and agricultural activities around the world. Water is prime need for human survival ad industrial development. For many rural and small communities ground water is the only source of drinking water [3-4]. For groundwater monitoring, of hand pumps are one of the important tools for evaluating ground water quality. Considering these aspects of water pollution the present study of ground water monitoring was undertaken to investigate physico-chemical characteristics of some ground water sample from different location in Karwi city Chitrakoot
II. MATERIAL AND METHOD
|
Selected Station |
Station Code |
Latitude/ Longitude |
|
|
C.I.C
|
S1 |
25º12?46.056? |
|
|
??80? 55?14.952? |
|||
|
Allahabad Road
|
S2 |
25º12??13.04? |
|
|
80º55? 55.2? |
|||
|
SDM Colony |
S3 |
25??12? 49.278?? |
|
|
80?? 55?? 21.342?? |
|||
|
Railway Station |
S4 |
25º12? 50.288? |
|
|
80º55? 25.300? |
|||
|
Kacheri |
S5 |
25?12?? 51.96??? |
|
|
80?? 55? 15.04?? |
|||
|
Tehsil |
S6 |
25?12? 48.638? |
|
|
80?55? 24.018 |
|||
|
Mandi Bazar
|
S7 |
25º12 ?30.630? |
|
|
80º12? 40.640? |
|||
|
J M Colony |
S8 |
25?12? 35.357? |
|
|
80º54? 45.366? |
|||
|
G.G.I.C |
S9 |
25????12?40.902? |
80?54?? 45.396 ? |
Ground water samples were collected for a period of one month from 9 hand pumps of Karwi city. The sample was collected from the hand pumps after drawing water for ten minutes by pumping out. After the collection, the bottles were tightly closed, marked and labelled. The samples were brought to the laboratory for the chemical analysis. The sampling was done at fortnight interval. The water sample was analysed for physical and chemical parameters. The physical parameter to in order to check the acceptability of water. In the selected stretch of groundwater nine sampling stations were selected. Nine sampling station namely C.I.C, Allahabad Road, S.D.M Colony, Railway Station, Kacheri, Tehsil, Mandi bazaar, J.M Colony, G.G.I.C. Collection of water samples were collected from the hand pumps, used for domestic or irrigation purpose from the karwi Chitrakoot India. Determination of pH, Turbidity, Conductivity, Total Hardness, Determination of Calcium, Determination of Magnesium, Determination of Chloride, Alkalinity, Total Solid, Total Dissolved Solid, Determination of Sulphate.
III. Results & Discussion
The present investigation ground water quality of nine different hand pumps or different sites of Karwi city, district Chitrakoot. Understanding the ground water quality is important as it is the main factor determining its suitability for drinking; Domestic, Agricultural, and industrial purpose. Table- illustrates the physico-chemical parameters of groundwater in Karwi city, indicating the average values.
A. pH
The pH was observed ranged from 7.2-7.10. The minimum value was observed 6.82 at S3 and maximum was observed 7.80 at S8. All selected stations were found within the permissible limit prescribed by WHO (6.5-8.5). The study showed that the groundwater of the selected station was generally neutral to slightly alkalinity. Althose pH has no direct effect on the human health, it shows close relationship with some parameters of water.
B. Electrical Conductivity (EC)
The electric conductivity is the capacity of water to carry an electrical current and varies both with number and types of ions the solution (Dohare et.al, 2014). The total EC was found ranged from 695-1720 mg/l. The minimum value was observed 695 at S7 while maximum value was observed 1800 mg/l at S2. All selected stations were found within the permissible limit prescribed by BIS (800 mg/l). Electric conductivity value use can be used to estimate the dissolved solids concentration which may affect the test of water and suitability for various uses. Higher the conductivity value indicates higher the dissolve solid in water.
C. Turbidity (NTU)
The turbidity is measure by digital turbidity meter. Turbidity value of water samples varied between 00-9.9 NTU. Minimum value was found 000 at S1while maximum value was 9.9 at S9.
D. Total Hardness
The total hardness is the measure of the capacity of water to precipitate soap the hardness is more than 50 mg/l cause the RENAL CALCULI formation of kidney store. Hardness levels have a bearing on the toxicity of some metals. In general, these toxic effects are markedly less in waters with significant degree of hardness. The total hardness was found ranged from 332-884 mg/l. The minimum value was observed 332 mg/l S9 and maximum was observed 884. mg/l at S2. All selected stations were found within the permissible limit prescribed by BIS (600 mg/l).
E. Calcium Hardness
The calcium hardness range was observed 53.1-505.1 mg/l. The minimum value was observed 53.1 mg/l S7 and maximum was observed 505.1 mg/l at S2.
F. Magnesium
Magnesium is abundant and a major dietary requirement for humans. It is the second major constituent of hardness. Magnesium sulphate is used medicinally as "Epsom Salts," a laxative. The Magnesium was found ranged from16.7 – 95.64mg/l. The minimum value was observed 16.7 mg/l S7 and maximum was observed 95.64mg/l at S6. All selected stations were found within the permissible limit prescribed by BIS (35 mg/l) except S2 and S4.
G. Chloride
The chloride was found ranged from 40.52 -325.30mg/l. The minimum value was observed 40.52 at S7 while maximum value was observed 325.30 mg/l at S7. All selected stations were found within the permissible limit prescribed by BIS (1000 mg/l.)
H. Sulphate
The sulphate was found ranged from 61-113.62 mg/l. The minimum value was observed 61 at S6 while maximum value was observed 113.62 mg/l at S2. All selected stations were found within the permissible limit prescribed by BIS (1000 mg/l.)
I. TS
TS includes ionized and nonionized matter. The total solids were found ranged from 440-1410mg/l. The minimum value was observed 440 mg/l S7 and maximum was observed 1410 mg/l at S2. All selected stations were found within the permissible limit prescribed by WHO (2000 mg/l).
J. TDS
TDS includes ionized and nonionized matter. The total dissolved solids were found ranged from 435-1400 mg/l. The minimum value was observed 435mg/l S7 and maximum was observed 1400 mg/l at S2. All selected stations were found within the permissible limit prescribed by WHO (2000 mg/l)
|
S.No. |
Sample |
S1 |
S2 |
S3 |
S4 |
S5 |
S6 |
S7 |
S8 |
S9 |
|
1 |
pH |
7.2 |
6.85 |
6.82 |
6.96 |
6.87 |
7.16 |
7.47 |
7.30 |
7.10 |
|
2 |
EC |
1039 |
1800 |
1172 |
1265 |
1347 |
1077 |
721 |
1330 |
1040 |
|
3 |
Turbidity |
2.1 |
6.7 |
3.8 |
6.5 |
2.1 |
1.7 |
4.5 |
5.3 |
9.9 |
|
4 |
Total Hardness |
432 |
884 |
686 |
626 |
758 |
580 |
378 |
514 |
334 |
|
5 |
Calcium |
59.2 |
505.6 |
454.4 |
144 |
192 |
75.2 |
54.4 |
67.2 |
62.4 |
|
6 |
Magnesium |
69.296 |
19.52 |
56.12 |
64.904 |
67.832 |
95.648 |
59.048 |
84.424 |
43.432 |
|
7 |
Alkalinity |
589 |
655.5 |
479.75 |
536.75 |
441.75 |
603.25 |
612.75 |
494 |
589 |
|
8 |
Chloride |
81.56 |
325.32 |
188.76 |
185.76 |
228.18 |
80.14 |
40.54 |
105.6 |
89.58 |
|
9 |
Sulphate |
33.625 |
113.625 |
82.125 |
85.125 |
72.25 |
63 |
33.5 |
141.25 |
75.875 |
|
10 |
Total Solid |
800 |
1280 |
1040 |
1000 |
1080 |
840 |
520 |
1040 |
880 |
|
11 |
TDS |
760 |
1400 |
960 |
960 |
800 |
600 |
440 |
880 |
760 |
Table-1: Physico-chemical characteristics of Ground water of Karwi city
|
S.No. |
Sample |
S1 |
S2 |
S3 |
S4 |
S5 |
S6 |
S7 |
S8 |
S9 |
|
1 |
pH |
8.10 |
7.85 |
7.60 |
7.56 |
7.35 |
7.95 |
7.82 |
8.10 |
7.41 |
|
2 |
EC |
1003 |
1720 |
1028 |
1226 |
1036 |
1021 |
695 |
1254 |
1008 |
|
3 |
Turbidity |
431 |
883 |
682 |
621 |
754 |
575 |
375 |
510 |
332 |
|
4 |
Total Hardness |
58.2 |
505.3 |
454.1 |
140 |
182 |
74.1 |
53.1 |
64.1 |
61.2 |
|
5 |
Calcium |
68.29 |
19.50 |
56.10 |
63.90 |
67.83 |
95.64 |
59.04 |
84.42 |
43.43 |
|
6 |
Magnesium |
68.29 |
19.50 |
56.10 |
63.90 |
67.83 |
95.64 |
59.04 |
84.42 |
43.43 |
|
7 |
Alkalinity |
574 |
644.4 |
478.74 |
536.74 |
441.73 |
603.2 |
612.7 |
490 |
584 |
|
8 |
Chloride |
81.54 |
325.30 |
188.59 |
185.7 |
228.17 |
80.10 |
40.52 |
105.4 |
89.54 |
|
9 |
Sulphate |
33.621 |
112.62 |
82.121 |
85.122 |
72.23 |
61 |
33.1 |
191.2 |
75.84 |
|
10 |
Total Solid |
779 |
1278 |
1038 |
999 |
1079 |
837 |
519 |
1038 |
875 |
|
11 |
TDS |
755 |
1399 |
978 |
948 |
798 |
599 |
435 |
878 |
761 |
Table-2: Physico-chemical characteristics of Ground water of Karwi city
|
S.NO. |
Month |
S1 |
S2 |
S3 |
S4 |
S5 |
S6 |
S7 |
S8 |
S9 |
|
1 |
Feb 1 |
7.2 |
6.85 |
6.82 |
6.96 |
6.87 |
7.16 |
7.47 |
7.30 |
7.10 |
|
|
|
|
|
|
|
|
|
|
|
|
|
2 |
Feb2 |
8.10 |
7.85 |
7.60 |
7.56 |
7.35 |
7.95 |
7.82 |
8.10 |
7.41 |
|
Mean |
7.65 |
10.775 |
7.21 |
7.26 |
7.11 |
7.555 |
7.645 |
7.7 |
7.255 |
|
|
4 |
SD |
0.636 |
0.707107 |
0.551543 |
0.424264 |
0.339411 |
0.558614 |
0.247487 |
0.565685 |
0.219203 |
|
|
Min |
7.2 |
6.85 |
6.82 |
6.96 |
6.87 |
7.16 |
7.47 |
7.30 |
7.10 |
|
|
Max |
8.10 |
7.85 |
7.60 |
7.56 |
7.35 |
7.95 |
7.82 |
8.10 |
7.41 |
Table-3: pH at different sampling stations
|
S.NO. |
Month |
S1 |
S2 |
S3 |
S4 |
S5 |
S6 |
S7 |
S8 |
S9 |
|
1 |
Feb 1 |
1039 |
1800 |
1172 |
1265 |
1347 |
1077 |
721 |
1330 |
1040 |
|
2 |
Feb2 |
1003 |
1720 |
1028 |
1226 |
1036 |
1021 |
695 |
1254 |
1008 |
|
3 |
Mean |
1021 |
1760 |
1100 |
1245.5 |
1191.5 |
1049 |
708 |
1292 |
10241 |
|
4 |
SD |
25.45584
|
56.56854
|
101.8234
|
27.57716 |
219.9102
|
39.59798
|
18.38478 |
53.74012
|
22.62742
|
|
|
Min |
1003 |
1720 |
1028 |
1226 |
1036 |
1021 |
695 |
1254 |
1008 |
|
|
Max |
1039 |
1800 |
1172 |
1265 |
1347 |
1077 |
721 |
1330 |
1040 |
Table-4: EC at different sampling stations
|
S.NO. |
Month |
S1 |
S2 |
S3 |
S4 |
S5 |
S6 |
S7 |
S8 |
S9 |
|
1 |
Feb 1 |
2.1 |
6.7 |
3.8 |
6.5 |
2.1 |
1.7 |
4.5 |
5.3 |
9.9 |
|
2 |
Feb2 |
000 |
004.1 |
000.3 |
002.0 |
000.0 |
000.5 |
000.6 |
002.3 |
012.6 |
|
3 |
Mean |
1.05 |
3.4 |
2.05 |
4.25 |
1.05 |
1.1 |
2.55 |
2.8 |
5.013 |
|
4 |
SD |
1.484924 |
1.838478 |
2.474874 |
3.181981 |
1.484924 |
0.848528 |
2.757716 |
2.12132 |
1.909188 |
|
|
Min |
000 |
004.1 |
000.3 |
002.0 |
000.0 |
000.5 |
000.6 |
002.3 |
012.6 |
|
|
Max |
2.1 |
6.7 |
3.8 |
6.5 |
2.1 |
1.7 |
4.5 |
5.3 |
9.9 |
Table-5: Turbidity at different sampling stations
|
S.NO. |
Month |
S1
|
S2 |
S3 |
S4 |
S5 |
S6 |
S7 |
S8 |
S9 |
|
1
|
Feb 1 |
432 |
884 |
686 |
626 |
758 |
580 |
378 |
514 |
334 |
|
2
|
Feb2 |
431 |
883 |
682 |
621 |
754 |
575 |
375 |
510 |
332 |
|
3
|
Mean |
431.5 |
883.5 |
684 |
623.5 |
756 |
577.5 |
376.5 |
512 |
333 |
|
4
|
SD |
0.707107
|
0.707107
|
2.828427
|
3.535534
|
2.828427
|
3.535534 |
2.12132 |
2.828427 |
1.414214
|
|
|
Min |
431 |
883 |
682 |
621 |
754 |
575 |
375 |
510 |
332 |
|
|
Max |
432 |
884 |
686 |
626 |
758 |
580 |
378 |
514 |
334 |
Table6: Total Hardness at different sampling stations
|
S.NO. |
Month |
S1 |
S2 |
S3 |
S4 |
S5 |
S6 |
S7 |
S8 |
S9 |
|
1 |
Feb 1 |
59.2 |
505.6 |
454.4 |
144 |
192 |
75.2 |
54.4 |
67.2 |
62.4 |
|
2 |
Feb2 |
58.2 |
505.3 |
454.1 |
140 |
182 |
74.1 |
53.1 |
64.1 |
61.2 |
|
3 |
Mean |
58.7 |
505.45 |
454.25 |
142 |
187 |
74.65 |
53.75 |
65.65 |
61.8 |
|
4 |
SD |
0.707107 |
0.212132 |
0.212132 |
2.828427 |
7.071068 |
0.777817 |
0.919239 |
2.192031 |
0.848528 |
|
|
Min |
58.2 |
505.3 |
454.1 |
140 |
182 |
74.1 |
53.1 |
64.1 |
61.2 |
|
|
Max |
59.2 |
505.6 |
454.4 |
144 |
192 |
75.2 |
54.4 |
67.2 |
62.4 |
Table 7: Calcium at different sampling stations
Table8: Magnesium at different sampling stations
|
S.NO. |
Month |
S1 |
S2 |
S3 |
S4 |
S5 |
S6 |
S7 |
S8 |
S9 |
|
1 |
Feb 1 |
69.29 |
19.52 |
56.12 |
64.9 |
67.8 |
95.6 |
59.0 |
84.4 |
43.432 |
|
2 |
Feb2 |
68.29 |
19.50 |
56.10 |
63.90 |
67.83 |
95.64 |
59.04 |
84.42 |
43.43 |
|
3 |
Mean |
68.79 |
9.755 |
56.11 |
64.4 |
67.815 |
95.62 |
59.02 |
84.41 |
43.431 |
|
4 |
SD |
0.707107 |
0.014142 |
0.014142 |
0.707107 |
0.021213 |
0.028284 |
0.028284 |
0.014142 |
0.001414 |
|
|
Min |
68.29 |
19.50 |
56.10 |
63.90 |
67.8 |
95.6 |
59.0 |
84.4 |
43.43 |
|
|
Max |
69.29 |
19.52 |
56.12 |
64.9 |
67.83 |
95.64 |
59.04 |
84.42 |
43.432 |
|
S.NO. |
Month |
S1 |
S2 |
S3 |
S4 |
S5 |
S6 |
S7 |
S8 |
S9 |
|
1 |
Feb 1 |
589 |
655.5 |
479.75 |
536.75 |
441.7 |
600.2 |
610.7 |
494 |
589 |
|
2 |
Feb2 |
574 |
644.4 |
478.74 |
536.74 |
441.73 |
603.2 |
612.7 |
490 |
584 |
|
3 |
Mean |
581.5 |
649.95 |
479.245 |
536.745 |
441.715 |
601.7 |
611.7 |
492 |
586.5 |
|
4 |
SD |
10.6066 |
7.848885 |
0.714178 |
0.007071 |
0.021213 |
2.12132 |
1.414214 |
2.828427 |
3.535534 |
|
|
Mn |
574 |
644.4 |
478.74 |
536.74 |
441.7 |
600.2 |
610.7 |
490 |
584 |
|
|
Max |
589 |
655.5 |
479.75 |
536.75 |
441.73 |
603.2 |
612.7 |
494 |
589 |
Table9: Alkalinity at different sampling stations
|
S.NO |
Month |
S1 |
S2 |
S3 |
S4 |
S5 |
S6 |
S7 |
S8 |
S9 |
|
1 |
Feb 1 |
81.56 |
325.32 |
188.59 |
185.76 |
228.1 |
80.14 |
40.54 |
105.6 |
89.58 |
|
9 |
Feb2 |
81.54 |
325.30 |
183.59 |
185.7 |
228.17 |
80.10 |
40.52 |
105.4 |
89.54 |
|
3 |
Mean |
81.55 |
325.31 |
186.09 |
185.73 |
456.27 |
80.12 |
40.53 |
105.5 |
89.56 |
|
4 |
SD |
0.014142 |
0.014142 |
3.535534 |
0.042426 |
0.049497 |
0.028284 |
0.014142 |
0.141421 |
0.028284 |
|
|
Min |
81.54 |
325.32 |
183.59 |
185.7 |
228.1 |
80.10 |
40.52 |
105.4 |
89.54 |
|
|
Max |
81.56 |
325.30 |
188.59 |
185.76 |
228.17 |
80.14 |
40.54 |
105.6 |
89.58 |
Table 10: Chloride at different sampling stations
|
S.NO |
Month |
S1 |
S2 |
S3 |
S4 |
S5 |
S6 |
S7 |
S8 |
S9 |
|
1 |
Feb 1 |
33.625 |
113.62 |
82.12 |
85.12 |
72.25 |
63 |
33.5 |
141.2 |
75.87 |
|
2 |
Feb2 |
33.621 |
112.62 |
82.121 |
85.122 |
72.23 |
61 |
33.1 |
191.2 |
75.84 |
|
3 |
Mean |
33.623 |
113.12 |
82.1205 |
85.121 |
72.24 |
62 |
33.3 |
166.2 |
75.855 |
|
4 |
SD |
0.002828 |
0.707107 |
0.000707 |
0.001414 |
0.014142 |
1.414214 |
0.282843 |
35.35534 |
0.021213 |
|
|
Min |
33.621 |
112.62 |
82.12 |
85.12 |
72.23 |
61 |
33.1 |
141.2 |
75.84 |
|
|
Max |
33.625 |
113.62 |
82.121 |
85.122 |
72.25 |
63 |
33.5 |
191.2 |
75.87 |
|
S.NO |
Month |
S1 |
S2 |
S3 |
S4 |
S5 |
S6 |
S7 |
S8 |
S9 |
|
1 |
Feb 1 |
800 |
1280 |
1040 |
1000 |
1080 |
840 |
520 |
1040 |
880 |
|
2 |
Feb2 |
760 |
1410 |
960 |
960 |
800 |
600 |
440 |
880 |
760 |
|
3 |
Mean |
780 |
1345 |
1000 |
980 |
940 |
720 |
480 |
960 |
82033 |
|
4 |
SD |
28.28427 |
91.92388 |
56.56854 |
28.28427 |
197.9899 |
169.7056 |
56.56854 |
113.1371 |
84.85281 |
|
|
Min |
760 |
1280 |
960 |
960 |
800 |
600 |
440 |
880 |
760 |
|
|
Max |
800 |
1410 |
1040 |
1000 |
1040 |
840 |
520 |
1040 |
880 |
Table 12: Total Solid at different sampling stations
|
S.NO |
Month |
S1 |
S2 |
S3 |
S4 |
S5 |
S6 |
S7 |
S8 |
S9 |
|
1 |
Feb 1 |
760 |
1400 |
960 |
960 |
800 |
600 |
440 |
880 |
760 |
|
2 |
Feb2 |
755 |
1399 |
978 |
948 |
798 |
599 |
435 |
878 |
761 |
|
3 |
Mean |
757.5 |
1399.5 |
969 |
954 |
799 |
599.5 |
437.5 |
879 |
760.5 |
|
4 |
SD |
3.535534 |
0.707107 |
12.72792 |
8.485281 |
1.414214 |
0.707107 |
3.535534 |
1.414214 |
0.707107 |
|
|
Min |
755 |
1399 |
960 |
948 |
798 |
599 |
435 |
878 |
760 |
|
|
Max |
760 |
1400 |
978 |
960 |
800 |
600 |
440 |
880 |
761 |
Table 13: Total Dissolved Solid at different sampling stations
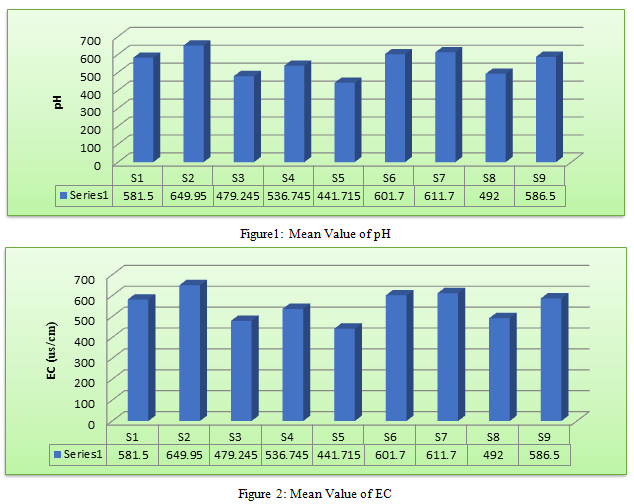
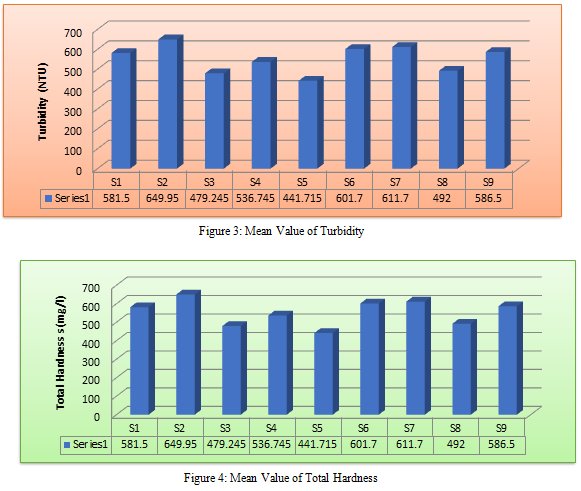
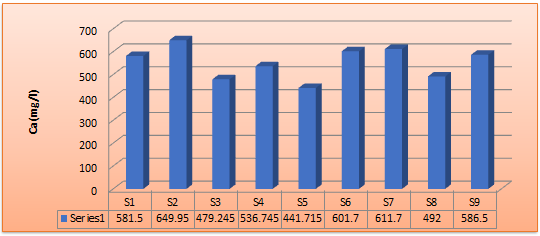
Figure 5 : Mean Value of Calcium
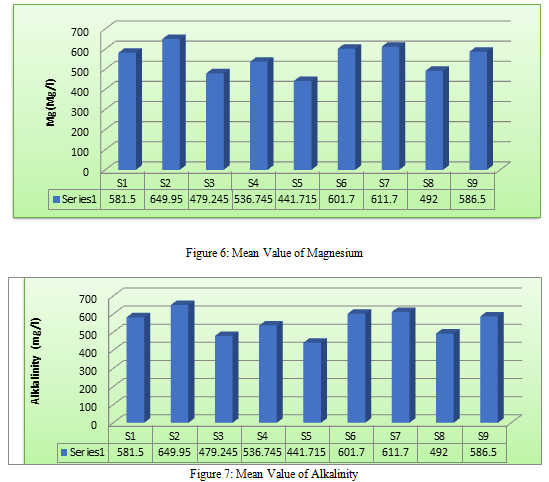
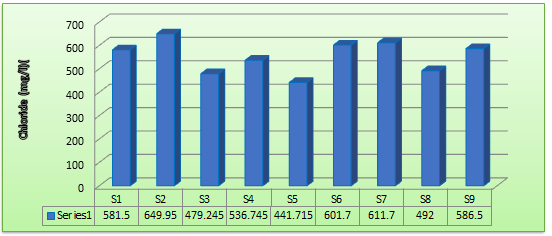
Figure 8: Mean Value of Chloride
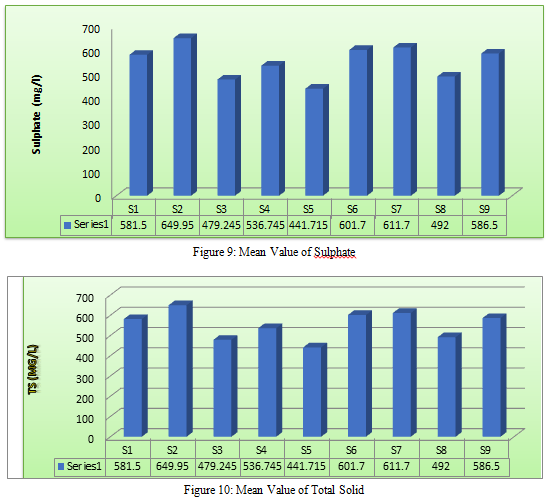
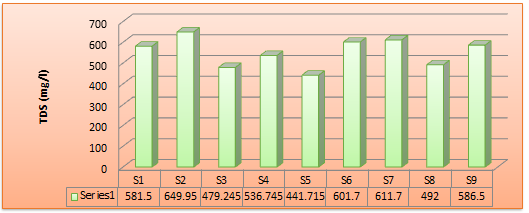
Figure 11: Mean Value of Total Dissolved Solid
Conclusion
Total Nine groundwater sample were selected for study of Physico-chemical quality of water at Karwi city. From the study it was conclude that all ground water samples were observed within the limit prescribed by BIS/WHO except Mg hardness at S6 (95.64 mg/l) & S8(84.42 mg/l) and Ca at S2 (505.0 mg/l) & S3 (454.4 mg/l). Hence, these samples of water absolutely fit for drinking propose sum essential treatment needed to Ca hardness & Mg hardness to convert in drinkable water.Total Nine groundwater sample were selected for study of Physico-chemical quality of water at Karwi city. From the study it was conclude that all ground water samples were observed within the limit prescribed by BIS/WHO except Mg hardness at S6 (95.64 mg/l) & S8(84.42 mg/l) and Ca at S2 (505.0 mg/l) & S3 (454.4 mg/l). Hence, these samples of water absolutely fit for drinking propose sum essential treatment needed to Ca hardness & Mg hardness to convert in drinkable water.
References
Total Nine groundwater sample were selected for study of Physico-chemical quality of water at Karwi city. From the study it was conclude that all ground water samples were observed within the limit prescribed by BIS/WHO except Mg hardness at S6 (95.64 mg/l) & S8(84.42 mg/l) and Ca at S2 (505.0 mg/l) & S3 (454.4 mg/l). Hence, these samples of water absolutely fit for drinking propose sum essential treatment needed to Ca hardness & Mg hardness to convert in drinkable water.
Copyright
Copyright © 2024 Yoshita Ray, G. S. Gupta. This is an open access article distributed under the Creative Commons Attribution License, which permits unrestricted use, distribution, and reproduction in any medium, provided the original work is properly cited.

Download Paper
Paper Id : IJRASET64619
Publish Date : 2024-10-15
ISSN : 2321-9653
Publisher Name : IJRASET
DOI Link : Click Here
 Submit Paper Online

