Ijraset Journal For Research in Applied Science and Engineering Technology
- Home / Ijraset
- On This Page
- Abstract
- Introduction
- Conclusion
- References
- Copyright
Wind-Induced Responses in Tall Steel Buildings Using International Standards
Authors: Sakshi Kirar, Rakesh Patwa, Dr. Savita Maru
DOI Link: https://doi.org/10.22214/ijraset.2024.64262
Certificate: View Certificate
Abstract
Tall buildings are being developed due to rapid urbanization, as land availability decreases and population growth increases. High-rise buildings are more susceptible to wind forces, making their structures dynamically sensitive at greater elevations. The gust factor, a pseudo-static constant, is provided by several nations to compute dynamic wind forces. This study compares the structural response of tall steel buildings with V-bracing, X-bracing, and Chevron bracing under dynamic wind loading, using four different codes and standards: India (IS 875:2015 part-3), America (ASCE 7-16), Australia/New Zealand (AZ/NZS 1170.2:2011), and Canada (NBCC 2015) for varying structure heights and exposure conditions (Open and Rough). The finite element software ETABSv.18 is utilized for analysis. All the structures produce acceptable outcomes in both the Open and Rough Exposure categories. Finally, conclusions are drawn from comparing evaluated dynamic lateral forces, showing that Chevron bracing produces the most satisfying results. The story drifts, maximum story displacement, base shear, and overturning moments are used to evaluate the results.
Introduction
I. INTRODUCTION
Tall buildings have gained significant relevance in this age of rapid urbanization as they maximize space use on limited land and serve as symbols of national success. However, as structures grow taller, natural forces, including wind, become more powerful, posing a dynamic challenge to structural engineers. The Gust Factor Method, an equivalent static wind load approach, evaluates wind loads based on the structure's height, location, and exposure. This approach depends on several factors including the wind velocity profile, turbulence intensity, and other wind field characteristics.
This study evaluates the dynamic wind forces on G+34 (105.00 m) and G+40 (123.00 m) structures in two different exposure categories, Open and Rough, using four country codes: India (IS 875 (III):2015), America (ASCE 07-16), Australia/New Zealand (AZ/NZS 1170.2:2011), and Canada (NBCC 2015).
II. MODELING OF STRUCTURES
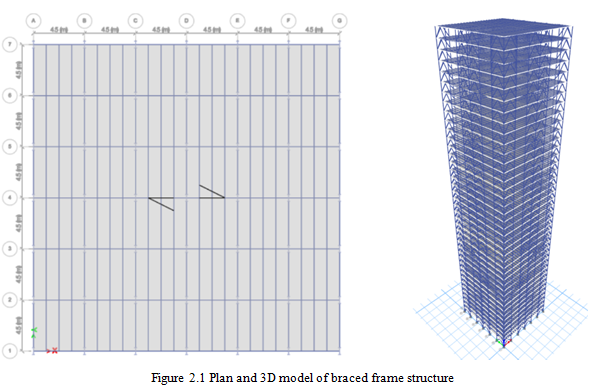
The following structural models were created for the Open and Rough Exposures in ETABSv.18. A square structure with a width of 27.0 m is used. The structural categories and their descriptions are provided in Table 2.1. The material properties are given in Table 2.2 and see Figure 2.1 for a plan and 3D view of the modeled structure.
- Steel building with V-Bracing termed as G+34V, and G+40V.
- Steel building with X-Bracing termed as G+34X, and G+40X
- Steel building with Chevron-Bracing termed as G+34C, and G+40C.
Here, G+34, and G+40 are the 34, and 40-storied structures with 105.0m, and 123.0m heights respectively.
Table 2.1: Structure Parameters
|
S. No. |
Particular |
G+34 |
G+40 |
|
1. |
Structure Types |
Steel Building with V-bracing |
|
|
Steel Building with X-bracing |
|||
|
Steel Building with Chevron-bracing |
|||
|
2. |
Number of stories |
35 |
41 |
|
3. |
Building Height |
105.00m |
123.00m |
|
4. |
Building Plan |
27.0m x 27.0m |
27.0m x 27.0m |
|
5. |
Story Height |
3.0m |
3.0m |
|
6. |
Column Size |
ISWB 600-2 |
ISWB 600-2 |
|
7. |
Beam Size |
ISMB 600 |
ISMB 600 |
|
8. |
Secondary Beam for Slab |
ISMB 300 |
ISMB 300 |
|
9. |
Size of Bracing |
ISMB 600 |
ISMB 600 |
|
10. |
Slab Thickness |
120.0mm |
120.0mm |
|
11. |
Column-foundation Joint |
Fixed at base |
Fixed at base |
|
12. |
Exposure Category |
Open and Rough |
Open and Rough |
Table 2.2: Material Properties of Buildings
|
S.No. |
Material |
Grade |
|
1. |
Steel Grade |
Fe345 |
|
2. |
Density of Steel |
7850 Kg/m3 |
|
3. |
Rebar |
HYSD500 |
|
4. |
Young’s Modulus (E) |
2.10 x 10⁵ N/mm2 |
|
5. |
Shear Modulus |
80,000 N/mm2 |
|
6. |
Poisson’s Ratio (µ) |
0.30 |
|
7. |
Concrete Grade |
M30 |

III. PARAMETRIC EVALUATION
The calculation of dynamic wind loading using the gust factor approach is influenced by numerous factors. Each code's computation involves parameters like the resonance response peak factor, size reduction factor, background turbulence factor, energy ratio, reduced frequency, and turbulence length scale shown in Table 3.1.
Table 3.1: Dynamic Wind Load Parameters
|
S. No. |
Parameters |
Description |
IS |
ASCE |
AZ/NZS |
NBCC |
|
|
1 |
Resonance response peak factor (gR) |
Exposure Open |
G+34 |
3.896 |
4.108 |
2.244 |
3.947 |
|
G+40 |
3.855 |
4.070 |
2.213 |
3.919 |
|||
|
Exposure Rough |
G+34 |
3.896 |
4.108 |
2.244 |
3.918 |
||
|
G+40 |
3.855 |
4.070 |
2.213 |
3.899 |
|||
|
2 |
Size reduction factor (S) |
Exposure Open |
G+34 |
0.090 |
0.444 |
0.081 |
0.044 |
|
G+40 |
0.100 |
0.502 |
0.091 |
0.062 |
|||
|
Exposure Rough |
G+34 |
0.042 |
0.339 |
0.037 |
0.034 |
||
|
G+40 |
0.050 |
0.392 |
0.046 |
0.050 |
|||
|
3 |
Background turbulence factor (B) |
Exposure Open |
G+34 |
0.756 |
0.839 |
0.730 |
0.768 |
|
G+40 |
0.763 |
0.831 |
0.709 |
0.732 |
|||
|
Exposure Rough |
G+34 |
0.718 |
0.811 |
0.730 |
0.768 |
||
|
G+40 |
0.726 |
0.804 |
0.709 |
0.732 |
|||
|
4 |
Energy ratio (E) |
Exposure Open |
G+34 |
0.064 |
0.062 |
0.060 |
0.149 |
|
G+40 |
0.070 |
0.068 |
0.066 |
0.181 |
|||
|
Exposure Rough |
G+34 |
0.051 |
0.063 |
0.042 |
0.135 |
||
|
G+40 |
0.057 |
0.068 |
0.048 |
0.167 |
|||
|
5 |
Reduced frequency (N) |
Exposure Open |
G+34 |
1.687 |
3.671 |
1.829 |
1.489 |
|
G+40 |
1.477 |
3.143 |
1.585 |
1.289 |
|||
|
Exposure Rough |
G+34 |
2.341 |
3.588 |
3.108 |
1.726 |
||
|
G+40 |
1.999 |
3.102 |
2.551 |
1.468 |
|||
|
6 |
Turbulence length scale (Lh), in m |
Exposure Open |
G+34 |
153.010 |
251.700 |
153.009 |
1220 (Constant for all) |
|
G+40 |
159.180 |
256.900 |
159.182 |
||||
|
Exposure Rough |
G+34 |
126.010 |
179.000 |
153.009 |
|||
|
G+40 |
131.090 |
188.600 |
159.182 |
||||
Table 3.1 shows a comparison of the calculated dynamic parameters. India demonstrates a more conservative approach with higher resonance response peak factors and energy ratios, explaining higher safety under dynamic wind loads. ASCE shows higher size reduction factors and reduced frequencies, reflecting detailed considerations of structural response. AZ/NZS provides consistent turbulence factors, indicating a balanced approach to wind effects. NBCC with higher turbulence length scales, gives a different perspective on turbulence impact. These variations highlight the different values used by each code.
IV. RESULTS AND DISCUSSION
Results are computed for V-bracing, X-bracing, and Chevron bracing structures using all four country codes. This section summarizes the maximum dynamic gust load, story displacement, story drift, story shear, and overturning moment.
A. Max Dynamic Gust Loa
The exposure category and height of the structure affect the dynamic lateral wind loads. Table 1.1 lists the calculated gust forces from the different country codes.
Table 1.1: Max. Dynamic Gust Load
|
Country Code |
G+34 |
G+40 |
||
|
OPEN |
ROUGH |
OPEN |
ROUGH |
|
|
ASCE |
224.266 |
169.545 |
233.136 |
179.537 |
|
AZ/NZS |
255.456 |
155.678 |
260.978 |
166.251 |
|
INDIA |
302.25 |
207.90 |
317.70 |
223.84 |
|
NBCC |
222.469 |
200.317 |
238.059 |
215.511 |
The Indian code gives the highest loads, especially in open terrain, reflecting a conservative approach. AZ/NZS also predicts high loads with a sharp terrain influence, while ASCE offers moderate values. NBCC shows minimal variation between open and rough terrains. Overall, all codes show increased loads with building height, the magnitude of variation may depend on each standard account for terrain and wind exposure. These differences highlight the varying safety margins and assumptions used globally.
B. Max. Story Displacements
Storey displacement is the term used to describe the swing in a story relative to its starting position. The top story of the building has the maximum story displacement. Story displacements significantly impact the structure's serviceability and safety. The structure is increasingly susceptible to lateral loading as more stories are displaced.

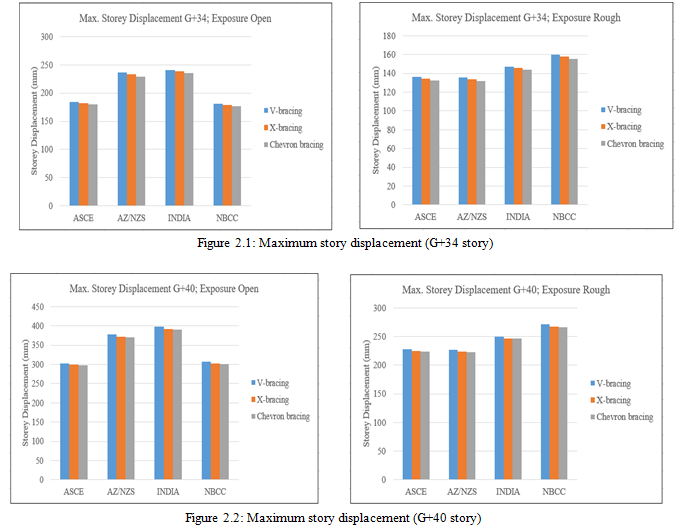
Figures. 2.1 and 2.2 display the bar chart comparisons for maximum story displacement. India shows the highest story displacements, allowing more movement due to its more flexible design approach and higher displacement limits. NBCC has the lowest displacements, reflecting stronger control and conservative design parameters. ASCE and AZ/NZS fall in between, with differences influenced by their varying wind load assumptions and structural flexibility requirements.
C, Max. Story Drift
It refers to the relative lateral displacement of one story of a building relative to the story below it due to applied lateral forces such as wind or seismic loads. It is an important parameter in structural engineering to ensure the safety and serviceability of a building under such loads.

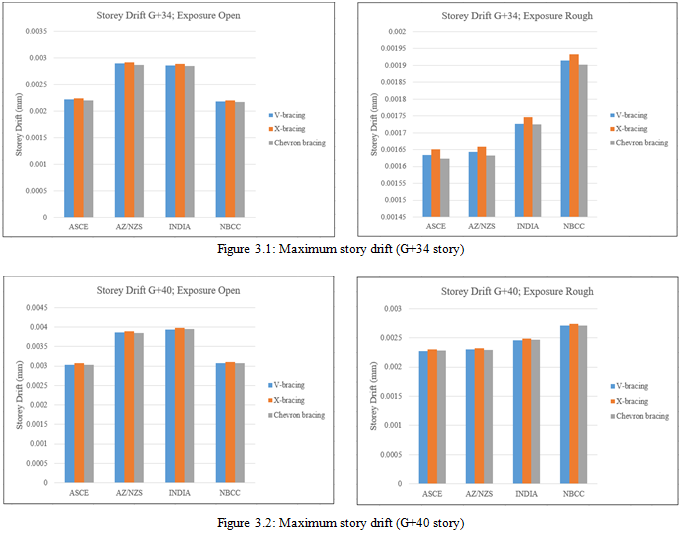
Figures. 3.1 and 3.2 display the bar chart comparison for story drifts. India consistently shows the highest story drifts, indicating a design that allows more building movement and permits greater flexibility. AZ/NZS also provides for higher drifts based on its design standards. Conversely, NBCC and ASCE show the lowest drifts, reflecting restrictions and a more rigid approach to design.
D. Base Shear
It is the total horizontal force acting at the base of a structure due to lateral loads such as wind, earthquakes, or other external forces. It represents the sum of all horizontal forces generated at the base of a building during such loading conditions. The base shear is a critical parameter in structural engineering as it helps determine the overall stability and design requirements of the building.

Figures. 4.1 and 4.2 display the bar chart comparison for base shear values. India shows the highest base shear values due to its more conservative wind load assumptions and higher safety factors. AZ/NZS also reports high base shears, especially in open conditions. ASCE presents moderate values, with notable increases in open conditions due to its wind load provisions. NBCC shows higher base shear in rough terrains, indicating terrain-specific adjustments. The variations arise from differences in wind load assumptions and safety margins, as well as how each code accounts for terrain effects, with NBCC focusing more on rough conditions, while India and AZ/NZS focus on wind intensity in open exposures.
E. Overturning Moment
It is a critical design parameter in structural engineering that represents the tendency of a structure to rotate or overturn due to lateral forces such as wind or seismic loads. It is the moment created by these lateral forces acting at a distance from the base of the structure, causing potential rotational effects that can compromise the stability of the building.

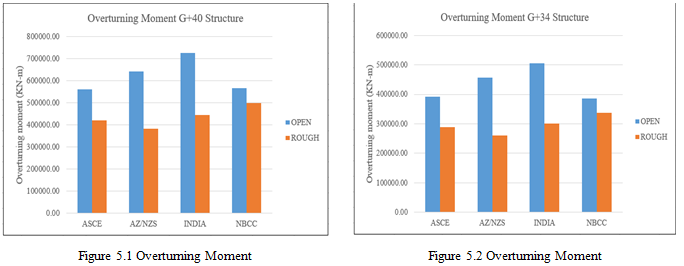
Figures. 5.1 and 5.2 display the bar chart comparison for overturning moments. India and AZ/NZS show high moments. ASCE presents lower values overall, with notable increases in open conditions. NBCC demonstrates higher moments in rough terrains, indicating adjustments for terrain-specific effects. These variations are influenced by each code’s wind load assumptions, safety margins, and how they account for different terrain conditions.
In the results, the varying velocity profiles and gust averaging times across the four wind codes have a noticeable impact on wind load predictions. The Indian code, with its power law profile and 3-second gust averaging, produces higher wind loads due to its more conservative design approach.
In contrast, ASCE and AZ/NZS use logarithmic profiles with the same 3-second gust, yet their wind load assessments vary due to differences in terrain considerations. NBCC’s use of a logarithmic profile with a 1-hour average wind speed leads to lower wind loads by smoothing out peak effects. These variations in wind profiles and averaging times result in differing wind-induced responses and structural performance outcomes across the codes.
Conclusion
The following conclusions may now be drawn from this study on structural performance under dynamic wind loading that was computed and compared with several country codes, namely those for America, Canada, Australia/New Zealand, and India: - 1) The Indian standard consistently predicts gust loads with the highest values, typically showing a percentage difference of approximately 20% to 30% higher than ASCE and NBCC standards, and around 10% to 20% higher than AZ/NZS standards. This reflects its conservative approach and robust safety margins in gust load estimation. 2) Across various bracing systems and exposure conditions, the Indian standard forecasts the highest displacements, with values typically 15% to 25% higher than ASCE and NBCC standards, and around 10% to 15% higher than AZ/NZS standards. V-bracing consistently results in higher displacements across all standards, indicating structural flexibility and response to wind forces. 3) The Indian standard also shows higher drift values compared to other standards, with approximately 20% to 30% higher values than ASCE, AZ/NZS, and NBCC standards. Chevron bracing consistently offers the lowest drift values, suggesting its effectiveness in minimizing structural movement. 4) In terms of base shear, the Indian standard predicts values that are generally 15% to 25% higher than ASCE and NBCC standards, and about 10% to 20% higher than AZ/NZS standards, reflecting its cautious design approach. ASCE and NBCC standards demonstrate more balanced responses to exposure conditions. 5) The Indian standard consistently forecasts overturning moments that are approximately 20% to 30% higher than ASCE, AZ/NZS, and NBCC standards, highlighting its conservative approach to structural stability against dynamic wind forces. The study highlights how different design principles and how sensitive ASCE, AZ/NZS, Indian, and NBCC standards are to dynamic wind loads. For the majority of indicators, the Indian norm typically yields higher values, suggesting a cautious design strategy with large safety margins. The analysis reveals that all structures perform well under both Open and Rough exposure conditions, but Chevron bracing consistently produces the most satisfactory results in terms of minimizing maximum story displacement and maximum story drift across all evaluated standards. The findings suggest that Chevron-braced structures are more efficient in resisting dynamic wind loads, followed by X-bracing and V-bracing configurations.
References
[1] IS 875 (III): 2015, Code of Practice for Design Loads (Other than Earthquake) for Buildings and Structures, Bureau of Indian Standards. [2] ASCE 7-16, Minimum Design Loads and Associated Criteria for Buildings and Other Structures, American Society of Civil Engineers. [3] AZ/NZS 1170.2:2011, Structural Design Actions, Part 2: Wind Actions, Standards Australia/Standards New Zealand. [4] NBCC 2015, National Building Code of Canada, National Research Council Canada. [5] Mendis P., Ngo T., Haritos N., Hira A., Samali B., Cheung J. “Wind Loading on Tall Buildings” Electronic Journal of Structural Engineering (EJSE) Special Issue: Loading on Structures, PP 41-54 (2007). [6] Bashor Rachel, Kareem Ahsan “Comparative Study of Major International Standards” The Seventh Asia-Pacific Conference on Wind Engineering, PP (November 2009). [7] Kwon Dae-Kun, Kareem Ahsan “Gust-Front Factor: New Framework for Wind Load Effects on Structures” Journal of Structural Engineering, American Society of Civil Engineers (JSE-ASCE), (June 2009). [8] Dr. B. Dean Kumar, Dr. B.L.P Swami “Wind effects on tall building frames-influence of dynamic parameters” Indian Journal of Science and Technology (IJST), Vol. 3, No. 5, ISSN 0974-6846, PP 583-587 (May 2010). [9] Dr. B. Dean Kumar, Dr. B.L.P Swami “Critical Gust Pressures on Tall Building Frames-Review of Codal Provisions” International Journal of Advanced Technology in Civil Engineering (IJATCE), Vol. 1, Issue: 2, ISSN: 2231 –5721 (2012). [10] Shrikanth, B. Vamsi Krishna “Study on the Effect of Gust Loads on Tall Buildings” International Journal of Structural and Civil Engineering Research (IJSCER), Vol. 3, No. 3, ISSN 2319-6009, PP 92-106, (August 2014). [11] Vikram M.B., Chandradhara G. P. 2, Keerthi Gowda B.S “A Study on Effect of Wind on The Static and Dynamic Analysis” International Journal of Emerging Trends in Engineering and Development (IJETED) R S. Publication, Vol. 3, Issue: 04, ISSN 2249-6149, PP 885-890 (May 2014). [12] Prof. Wakchaure M. R., Gawali Sayali “Effects of Shape on Wind Forces of High-Rise Buildings Using Gust Factor Approach” International Journal of Science, Engineering and Technology Research (IJSETR), Volume 4, Issue 8, PP 2979-2987 (August 2015). [13] Mashalkar B. S., Patil G. R., Jadhav A.S. “Effect of Plan Shapes on the Response of Buildings Subjected To Wind Vibrations” National Conference on Innovation in Engineering Science and Technology (NCIEST), International Organization of Scientific Research-Journal of Mechanical and Civil Engineering (IOSR-JMCE), e-ISSN: 2278-1684, p-ISSN: 2320–334X, PP 80-89, (2015). [14] Forrest Zhang, Alex “Comparative Study of Along Wind and Across Wind Loads on Tall Buildings with Different Codes” The 15th International Symposium on Structural Engineering, PP 723-728 (October 2016). [15] Lars Morten Bardal, Lars Roar Saetran “Wind gust factors in a coastal wind climate” 13th Deep Sea Offshore Wind R&D Conference, EERA DeepWind\'2016, Energy Procedia 94 (2016), PP 417 – 424 (January 2016). [16] Ahmed Shams, Prof. Mandal S. “Comparative Study of Along-Wind Response of Major International Codes with Indian Code” International Journal of Engineering Research & Technology (IJERT), Vol. 6 Issue 11, ISSN: 2278-0181, PP 256-260 (November 2017). [17] Akhtar Rabi, Prakash Shree, Baig Mirza Amir “Study of Comparison between Static and Dynamic Analysis Subjected to Wind and Earthquake Load” International Research Journal of Engineering and Technology (IRJET) Vol. 04 Issue: 07 e-ISSN: 2395-0056, p-ISSN: 2395-0072, (July 2017). [18] Kumar Sarath, Rajan S. Selvi “Estimation of Gust Response Factor for tall building model with 1:1.5 Plan Ratios” International Conference on Materials, Alloys, and Experimental Mechanism, IOP Conference Series: Materials Science & Engineering, Vol. 225, (July-2017). [19] Nourhan Sayed Fouad, Gamal Hussien Mahmoud, Nasr Eid Nasr “Comparative study of international codes wind loads and CFD results for low rise buildings” Alexandria Engineering Journal (AEJ), Vol. 57, Issue: 04, PP 3623-3639 (December 2018). [20] Channappagoudar Prakash, Palankar Vineetha, Vengadeshwari Shanthi R., Hiremath Rakesh “Parametric Comparison Study on The Performance of Building Under Lateral Loads as Per IS 875(Part3):1987 and Revised Code of IS 875(Part 3):2015” International Research Journal of Engineering and Technology (IRJET), Vol. 05 Issue: 05, e-ISSN: 2395-0056, p-ISSN: 2395-0072, PP 621-632, (May 2018). [21] Md Ahesan, Md Hameed, Amit Yennawar, “Comparative Study on Wind Load Analysis using Different Standards -A Review”, International Journal of Innovative Research in Science, Engineering, and Technology (IJIRSET) Vol. 07, Special Issue: 03, ISSN(Online): 2319-8753, ISSN(Print): 2347-6710, PP 64-70, (March 2018). [22] Er. Mayank Sharma, Er. Bhupinder Singh & Er. Ritu Goyal “Gust Factor Method for Wind Loads on Buildings and Indian Codal Provisions” International Journal of Engineering Sciences & Research Technology (IJESRT), ISSN: 2277-9655, CODEN: IJESS7, PP 621-632, (March 2018) [23] Aiswaria G.R., Dr. Jisha S.V. “Along and Across Wind Load Acting on tall buildings” Second International Conference on Architectural Materials and Construction Engineering (AMCE), PP 91-96, 2018. [24] Md Ahesan, Md Hameed, Salman Shaikh “Effect of Wind Loads on RC Building by using Gust Factor Approach” Journal of Emerging Technologies and Innovative Research (JETIR) Vol. 6 Issue:5, ISSN-2349-5162, PP 329-335, (May 2019).
Copyright
Copyright © 2024 Sakshi Kirar, Rakesh Patwa, Dr. Savita Maru. This is an open access article distributed under the Creative Commons Attribution License, which permits unrestricted use, distribution, and reproduction in any medium, provided the original work is properly cited.

Download Paper
Paper Id : IJRASET64262
Publish Date : 2024-09-17
ISSN : 2321-9653
Publisher Name : IJRASET
DOI Link : Click Here
 Submit Paper Online

